
Model overview
We used a validated mathematical model, the COVID-19 Simulator (www.covid19sim.org), to model the epidemiology of COVID-19 at the state-level in the U.S. Since May 2020, the Centers for Disease Control and Prevention (CDC) has incorporated our model outputs in its weekly COVID-19 forecasts.1
COVID-19 Simulator is a compartmental SEIR2 model with compartments for Susceptible, Exposed, Infectious, Recovered, and Dead individuals, stratified by Pol status (unvaccinated, partially vaccinated, fully vaccinated). Input data includes reported cases and deaths3, hospitalizations and ICU occupancy4, vaccine administration history5, and estimates for epidemiological parameters from clinical studies. The model is calibrated to reproduce historic trends in daily reported cases and deaths, and updated weekly as new data and evidence arise.
Model structure
A schematic of our compartmental model is shown in Figure 1.
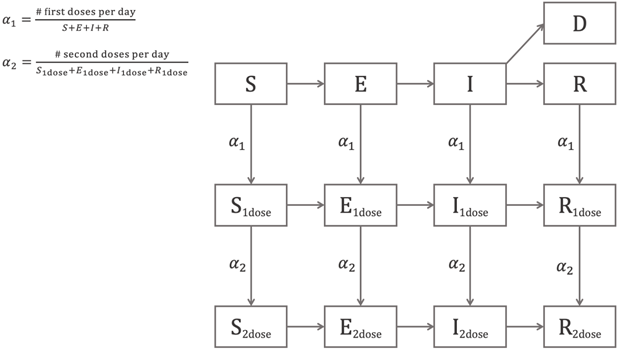
Figure 1. Schematic of the COVID-19 Simulator compartmental model.
The model is described by the following system of ordinary differential equations:
![]()
![]()
![]()
![]()
![]()
![]()
![]()
![]()
![]()
![]()
![]()
![]()
![]()
where
|
|
Number of susceptible individuals at time |
|
|
Number of exposed (latent) individuals at time |
|
|
Number of infectious individuals at time |
|
|
Number of recovered individuals at time |
|
|
Number of dead individuals at time |
|
|
Effective reproduction number at time |
|
|
Total population, |
|
|
Duration of the infectiousness period, |
|
|
Duration of the exposed (latent) period, |
|
|
Rate of first vaccine dose administration, |
|
|
Rate of second vaccine dose administration. |
The variable subscripts “![]() ”, “
”, “![]() ” differentiate individuals in the susceptible, exposed, infected, and recovered populations who have received one or two doses of the vaccine.
” differentiate individuals in the susceptible, exposed, infected, and recovered populations who have received one or two doses of the vaccine.
Model programming is performed in R (version 3.6.2). We use numerical solvers from the R package “deSolve”.6
Effective reproduction number
The transmission force of a pandemic under a given non-pharmaceutical intervention (NPI) is described by a parameter called the effective reproduction number, ![]() , defined as the average number of secondary infections per infectious case in a population made up of both susceptible and non-susceptible people. To reproduce the historic trends in cases and deaths, we allowed
, defined as the average number of secondary infections per infectious case in a population made up of both susceptible and non-susceptible people. To reproduce the historic trends in cases and deaths, we allowed ![]() to be a function of time to capture the effect of tightening and relaxing NPIs as the pandemic progresses. Specifically, we specify a stepwise function
to be a function of time to capture the effect of tightening and relaxing NPIs as the pandemic progresses. Specifically, we specify a stepwise function ![]() with 11 joinpoints
with 11 joinpoints ![]() (time points at which
(time points at which ![]() takes on a new value). We let the first 10 joinpoints be distributed uniformly over the historic time horizon from March 1, 2020, to the date of the latest data. We set
takes on a new value). We let the first 10 joinpoints be distributed uniformly over the historic time horizon from March 1, 2020, to the date of the latest data. We set ![]() to be 12 days before the date of the latest data point to capture the
to be 12 days before the date of the latest data point to capture the ![]() of current interventions.
of current interventions.
Reinfection
We assume reinfection is not possible within the time frame of the simulation based on the opinions of experts and emerging evidence that re-infections are rare.7–9
Infection fatality rate
For all states, we assume an average ![]() of 0.005 based on the CDC COVID-19 Pandemic Planning Scenarios10 current best estimates, weighted by the national population age distribution. The model infers the curve of total new infections (diagnosed and undiagnosed) over time based on the curve of deaths and the chosen infection fatality rate.
of 0.005 based on the CDC COVID-19 Pandemic Planning Scenarios10 current best estimates, weighted by the national population age distribution. The model infers the curve of total new infections (diagnosed and undiagnosed) over time based on the curve of deaths and the chosen infection fatality rate.
Vaccine effects
Starting from February 2021, COVID-19 Simulator accounts for vaccination rollout. The model captures the reduced fatality rate and susceptibility of vaccinated individuals. We assume 100% reduction in the infection fatality rate, along with 80% reduction in susceptibility of first-dose recipients and 90% reduction in susceptibility for second-dose recipients. Due to lack of data on disease status at the time of vaccination, we conservatively assume uniform distribution of vaccines across the susceptible, exposed, infected, and recovered populations. 11–13 Projecting forward, we fix vaccination rates at the latest rate from data.
Calibration of unobserved parameters
Because several parameters in the model are not directly observable, we estimate their values using a calibration approach. We begin by defining clinically plausible ranges:
- Initial number of infections
 : 0–1,000 cases
 - Latent period duration
 : 2–10 days14
 - Infectious period duration
 : 0.1–10 days15
 - Effective reproduction number RE: 0.5–4.00 secondary cases per infectious case
We calibrate using generalized simulated annealing (R package “GenSA” 16) to the curve of historic new deaths as the calibration target and mean squared error as the objective function. To account for uncertainty in the calibrated values, we repeat the calibration 100 times with different random seeds, resulting in 100 unique sets of parameter values and fitted curves. At each time point, we take the median to be the point estimate and compute the 95% credible interval.
Hospital beds capacity
Data on hospital beds capacity was extracted from the Centers for Medicare & Medicaid Services (CMS) annual cost reports (fiscal years 2016 through 2019). The data in these reports is accessible via CMS’s Healthcare Cost Report Information System (HCRIS)17. Data from four years was pooled for analysis to allow for correction of missing and inaccurate data. Hospitals that were deemed unlikely to be able to assist in a pandemic were not counted (e.g., alcohol and drug treatment hospitals, psychiatric hospitals, mental health hospitals, hospices, religious non-medical hospitals, skilled nursing facilities and homecare). For the estimation of ICU bed capacity, we included beds in similar units that could be repurposed for general intensive care in the event of a pandemic (e.g., cardiac critical care, burn ICU, surgical ICU).
We estimated the total number of hospital/ICU beds available to COVID-19 patients on a given day using hospitals’ reported bed days and inpatient days for each bed type. If a hospital reported bed numbers but not bed utilization numbers, we used the average occupancy rate over all states that provided this data.
Intervention Strategies
COVID-19 Simulator can model four different non-pharmaceutical interventions:
- Current intervention:
 the calibrated value over the last 12 days of data.
 - Stay-at-home orders: the minimum observed value during the period of nationwide stay-at-home orders between March and August 2020, as estimated by rt.live18.
- Lockdown:
 , the estimated value in Wuhan after lockdown of the region.19 This intervention assumes a complete ban on international, inter-state, and local travel, except for essential trips such as grocery shopping and filling prescriptions.
 - Minimal restrictions:
 . This intervention assumes minimal social distancing but there is a level of learned social awareness (handwashing, avoiding close contact when sick, etc.).
References
- Centers for Disease Control and Prevention. COVID-19 Forecasts: Deaths. Accessed April 12, 2021. https://www.cdc.gov/coronavirus/2019-ncov/covid-data/forecasting-us.html
- Kermack WO, McKendrick AG. A Contribution to the Mathematical Theory of Epidemics A Contribution to the Mathematical Theory of Epidemics. Vol 115.; 1927.
- Dong E, Du H, Gardner L. An interactive web-based dashboard to track COVID-19 in real time. The Lancet Infectious Diseases. 2020;20(5):533-534. doi:10.1016/S1473-3099(20)30120-1
- The COVID Tracking Project. The COVID Tracking Project. Accessed April 12, 2021. https://covidtracking.com/
- Hasell J, Mathieu E, Beltekian D, et al. A cross-country database of COVID-19 testing. Scientific Data. 2020;7(1):345. doi:10.1038/s41597-020-00688-8
- Soetaert K, Petzoldt T, Setzer RW. Solving differential equations in R: Package deSolve. Journal of Statistical Software. 2010;33(9):1-25. doi:10.18637/jss.v033.i09
- Hansen CH, Michlmayr D, Gubbels SM, Mølbak K, Ethelberg S. Assessment of protection against reinfection with SARS-CoV-2 among 4 million PCR-tested individuals in Denmark in 2020: a population-level observational study. The Lancet. 2021;397(10280):1204-1212. doi:10.1016/s0140-6736(21)00575-4
- Harvey RA, Rassen JA, Kabelac CA, et al. Association of SARS-CoV-2 Seropositive Antibody Test with Risk of Future Infection. JAMA Internal Medicine. Published online 2021. doi:10.1001/jamainternmed.2021.0366
- Lumley SF, O’Donnell D, Stoesser NE, et al. Antibody Status and Incidence of SARS-CoV-2 Infection in Health Care Workers. New England Journal of Medicine. 2021;384(6):533-540. doi:10.1056/NEJMoa2034545
- Centers for Disease Control and Prevention. COVID-19 Pandemic Planning Scenarios. Accessed April 12, 2021. https://www.cdc.gov/coronavirus/2019-ncov/hcp/planning-scenarios.html
- Polack FP, Thomas SJ, Kitchin N, et al. Safety and Efficacy of the BNT162b2 mRNA Covid-19 Vaccine. New England Journal of Medicine. 2020;383(27):2603-2615. doi:10.1056/NEJMoa2034577
- Baden LR, el Sahly HM, Essink B, et al. Efficacy and Safety of the mRNA-1273 SARS-CoV-2 Vaccine. New England Journal of Medicine. 2021;384(5):403-416. doi:10.1056/NEJMoa2035389
- Biotech J. Vaccines and Related Biological Products Advisory Committee February 26, 2021 Meeting Briefing Document- FDA.; 2021.
- Lauer SA, Grantz KH, Bi Q, et al. The incubation period of coronavirus disease 2019 (CoVID-19) from publicly reported confirmed cases: Estimation and application. Annals of Internal Medicine. 2020;172(9):577-582. doi:10.7326/M20-0504
- Li Q, Guan X, Wu P, et al. Early Transmission Dynamics in Wuhan, China, of Novel Coronavirus–Infected Pneumonia. New England Journal of Medicine. 2020;382(13):1199-1207. doi:10.1056/NEJMoa2001316
- Xiang Y, Gubian S, Suomela B, Hoeng J. Generalized Simulated Annealing for Global Optimization: The GenSA Package. R Journal. 2013;5(1).
- Centers for Medicaid and Medicare Services. Cost Reports. Accessed April 12, 2021. https://www.cms.gov/Research-Statistics-Data-and-Systems/Downloadable-Public-Use-Files/Cost-Reports
- Systrom K, Vladeck T, Krieger M. Rt.live. GitHub repository. Published online 2020. https://github.com/rtcovidlive/covid-model
- Pan A, Liu L, Wang C, et al. Association of Public Health Interventions With the Epidemiology of the COVID-19 Outbreak in Wuhan, China. JAMA. 2020;323(19):1915. doi:10.1001/jama.2020.6130